High Probability Day Trading Strategies
Updated at: 16 June 2023Deepak Painkra
The reason for this why I'm saying the high-probability trading strategy is that you rarely find this chart pattern in the market, and I'm going to use VIX(Volatility Index) terms to explain this chart pattern, but let's understand the VIX.
I will try to explain to you in simple terms, and I will not use any technical terms to confuse you,
What is VIX?
VIX shows how much fear there is in the market. I meant to say the volatility market. The Vix's high shows instability in the market, which is also responsible for trading options(premium) pricing fluctuations in the stock market.
For instance, we have S&P 500 VIX.By all means, if the market has more premiums, then it will let the market sideways. It always shows instability in the chart, which might hit your stop loss.
Note:-
This strategy is applicable for options, and stocks(stocks have implied volatility index) trading, which is different for the crypto and forex market because it is open 24/7 to take a trade. Forex market close at weekends like Saturday and Sunday. But crypto is always staying open.
So let's jump onto the main topic which I was talking about earlier,
Capture Big Moves in the Market
When there is less premium in the market, chances are very high, this will give you a bigger target, and whenever it breaks the range, you can either short the CALL option or buy the PUT option.
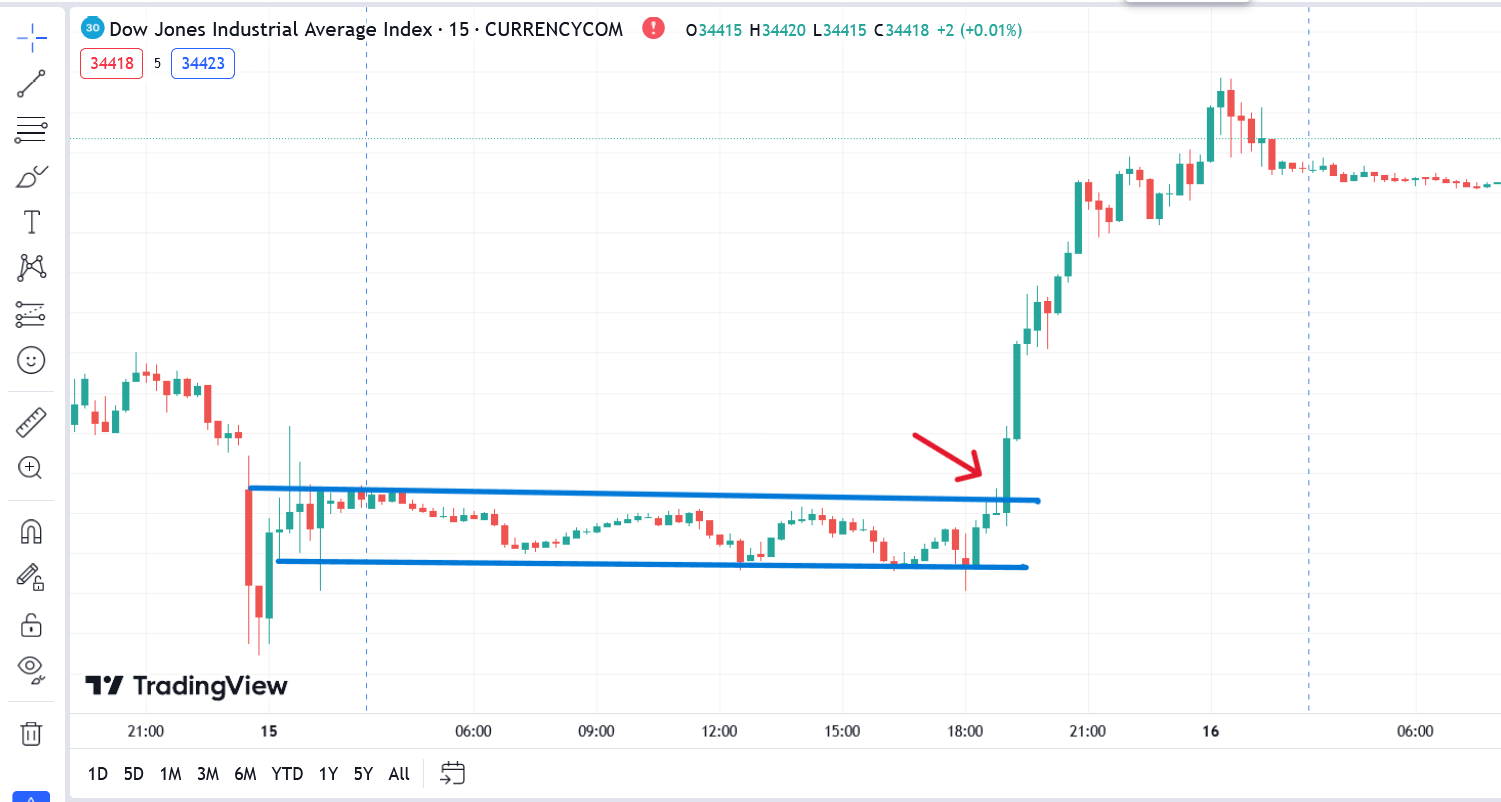
And this is how I captured this momentum, and as you can see in the chart, the market gives us 700 to 800 points, and if you have noticed. It retests the level and then gives you a breakout, which is also called Strong Breakout.
Find Rang Bound Market
Yes, I'm talking about the sideways market, and I'm showing in the chart as well, this is how it looks,
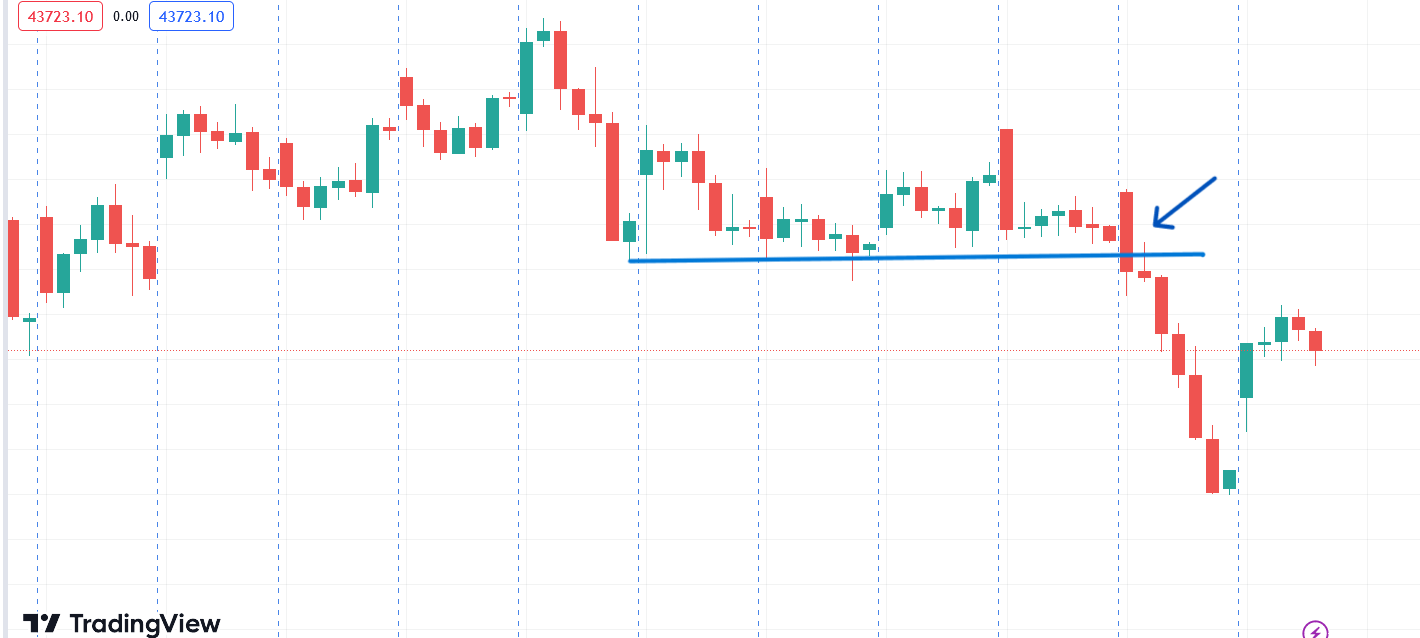
As you can see, whenever it breaks the top, it gives you good moves in the market. But let's understand how to trade this range-bound market.
How Trade Range Bound Market?
First, we need to choose the time frame, and it can be Fifteen min, One hour, a day or a week, and I'm showing the example where I used Day time frame, and as you can see, when the market breaks the range, it gives you good movement.
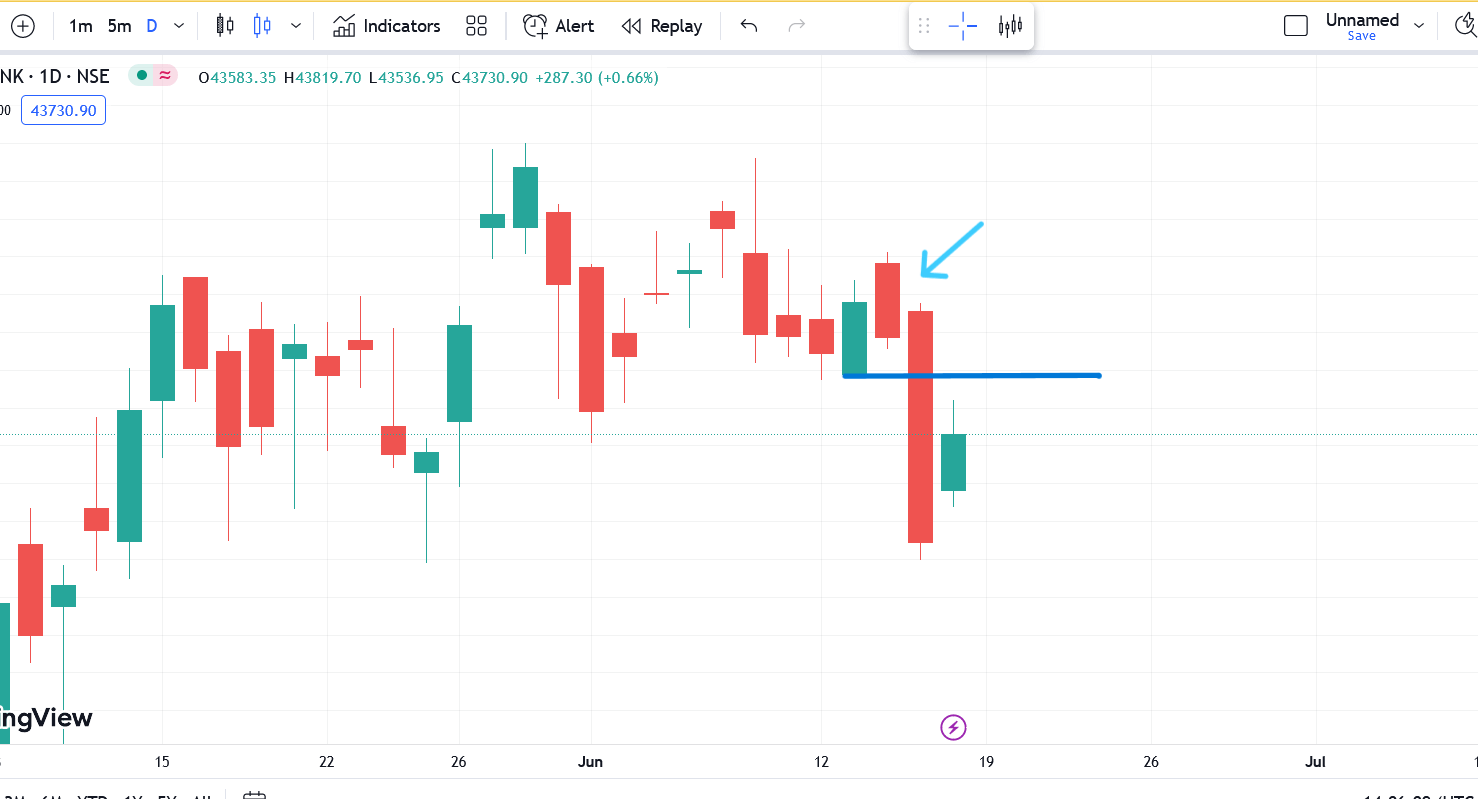
There are two rules to capture a big move in the market
- Either Stop Loss or Target
- See the Chart Pattern & Not the Profit & Loss Statement
Disclaimer
The information provided here is only for educational purpose. The information provided here is not intended to be any kind of financial advice, investment advice, and trading advice. Investment in stock market is very risky and trading stocks, options and other securities involve risk. The risk of loss in stock market can be substantial. So before taking any decision or before investing in any Share consult your financial advisor and also do your analysis and research.