How to identify a fake pole and flag pattern?
Updated at: 13 July 2025By Deepak Painkra
In this article, I will explain a concept for identifying fake pole and flag candlestick patterns so that you can distinguish between fake and real pole patterns in trading.
These concepts I have talked about in my other trading articles, which were related to different topics but let's use that concept for the pole and flag pattern as well.
1. Seeing the previous Trend
Based on the previous trend, we can identify whether the pole and flag pattern will be sustained or fail. Here is the concept to identify.
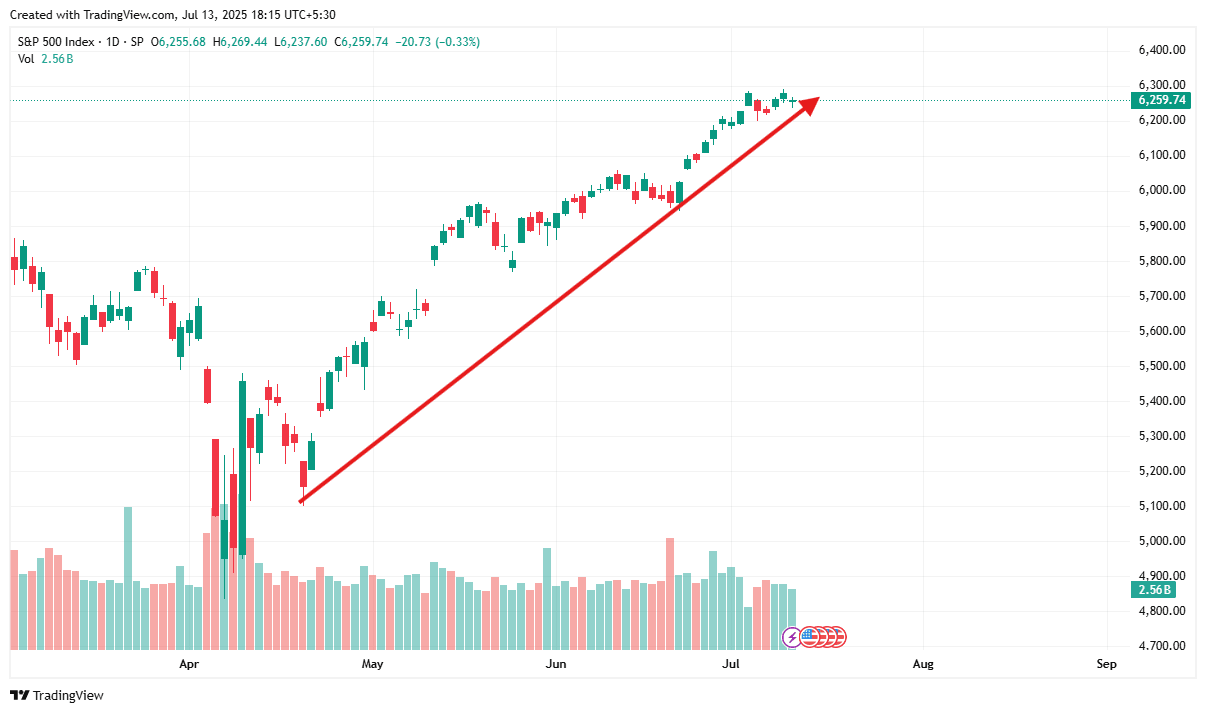
Bullishness:See the previous trend, if the previous trend is making a higher-high then there is a high chance that the pole and flag pattern will be sustained. In a simple word, if the previous trend is showing bullishness, the chart pattern can sustain. Let's take some examples from the live market to clear the concept.
Bearishness: Again see the previous trend, If the previous trend is making a lower low then there is a high chance it will fail. In this case, the previous trend is negative so the pole and flag can create a double top pattern.
2. Trend Shouldʼnt Recover more than 50% Recovery
The concept is not only useful for pole and flag pattern but it's also applicable for both breakout and breakdown strategy. But here we are talking about the pole and flag pattern, let me walk you through the concept while taking an example of a chart pattern for visual understanding.
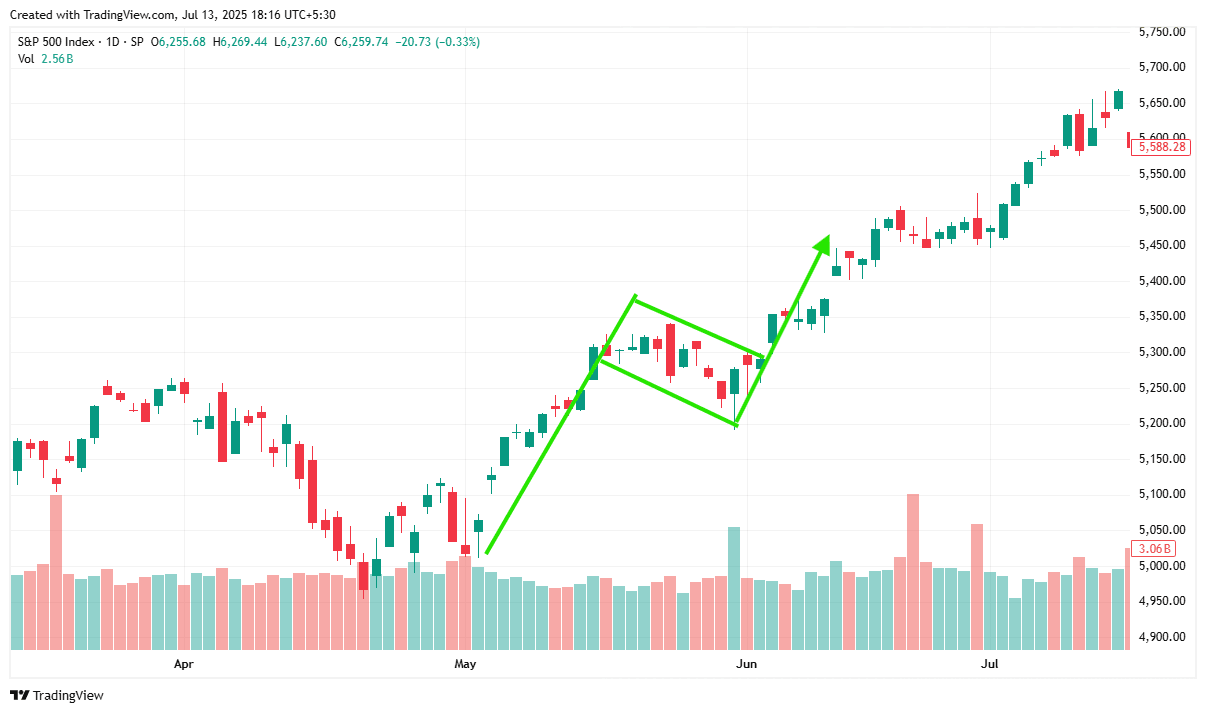
I'm taking an example of the S&P 500 . If you see the chart pattern that the previous trend is bullish, which is the concept that I talked about earlier. The market retraces, and it doesn't recover more than 50% also making a higher high, there will be a breakout and If it recovers more than 50% of the trend then selling will happen and the market will crash, We call it a fake breakout or a fake pole and flag pattern.
But here is the catch, the breakout zone works as support. The buyer who missed the bull run tries to accumulate so it might create a double top pattern, but not necessarily.
3. Consolidation is Crucial
When the market forms a pole & flag pattern chart without consolidating, there is a high chance it will be a fake breakout to trap buyers. The sideways market where both buyer and seller get trapped, what you can do is just wait for the market to decide the trend, and the breakdown will be too strong. The fake breakout can be called a phony pole and flag pattern.
Don't act early in the market to decide the trend.
4. Keep an Eye on High Water Stock
I always keep an eye on the high-watage stock when I trade on index options, as it helps to avoid taking the wrong entry in the fake breakout. In my case, I see the Banking sector which has the highest wages in the index option, it may be different its depending on the country where you are from.
Here is the important sector I always like to keep an eye on instead of checking individual stocks,
- 1. Banking & Financial Sector
- 2. VIX
- 3. IT Sector
You can also check the energy sector and other sectors but it can be confusing, so it's better to keep everything simple.
The last option will apply to the stock market.
Disclaimer
The information provided here is only for educational purpose. The information provided here is not intended to be any kind of financial advice, investment advice, and trading advice. Investment in stock market is very risky and trading stocks, options and other securities involve risk. The risk of loss in stock market can be substantial. So before taking any decision or before investing in any Share consult your financial advisor and also do your analysis and research.