How to Learn Price Action Trading
Updated at: 18 Feb 2024Deepak Painkra

To learn price action, first, you need to know how to read the chart pattern. In this article, I will walk you through some strategies to understand price action in options trading, so let's dive into it.
Table of Contens
- Price Action for Uptrend,
- Price Action Pattern for Uptrend
- Price Action Pattern for Uptrend
- Price Action Pattern for Downtrend
- 50% Recovery Breakout Rule
Let me walk you through some setup to understand the price action,
Price Action for Uptrend,
For uptrend moves, you need to wait for the first pullback and then draw the trade line to the recent high swing, and if the price breaks this recent high, it will give you upside moves. It is also called a double-bottom pattern. Let me show you in the chart pattern as well,
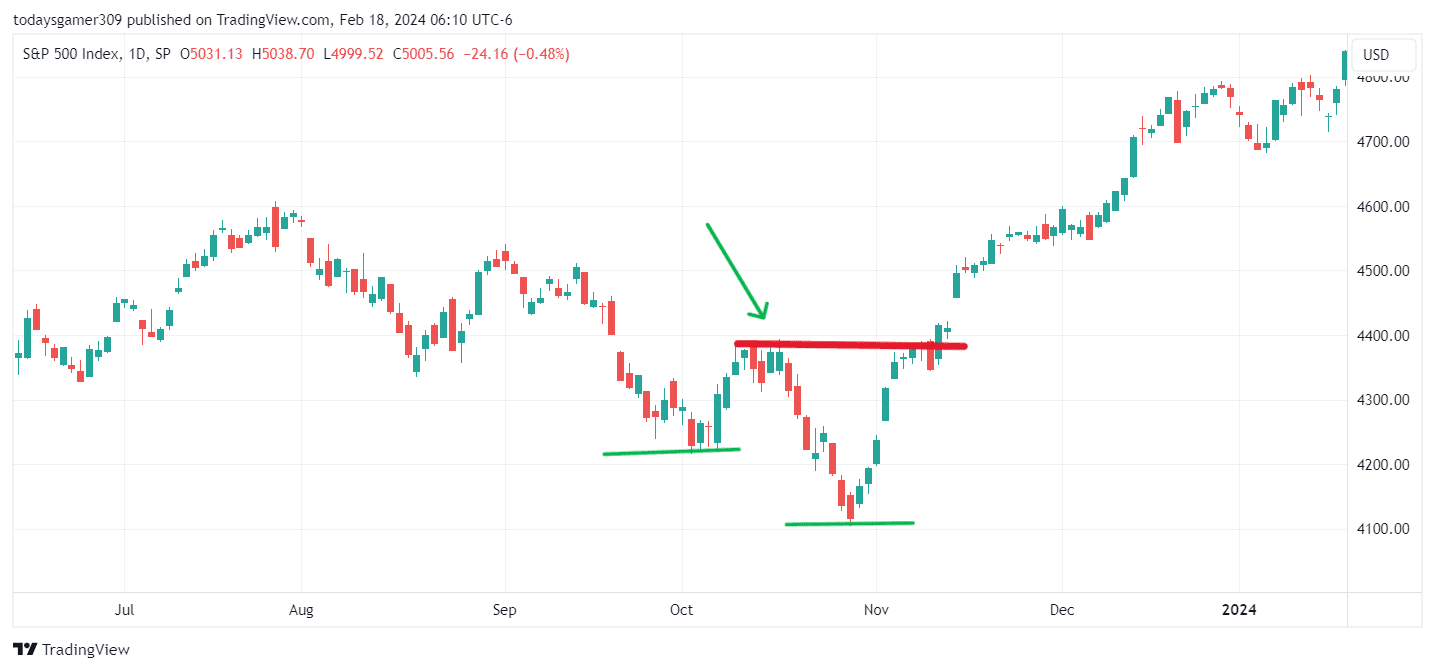
If you see this chart pattern, when the market breaks the recent swing, it gives good moves, but remember one thing.
In this case, it reversed instead of an upside breakout. It will be a breakout failure, and the seller will be active in this area and continue the downside moves, thus how the price action works.
Price Action Pattern for Uptrend
- Mother and Baby Candle
- Bullish Engulfing Candle
- Pole and Flag Pattern
- Double Bottom Pattern
These are the patterns you need to search for if you see opportunities for an upside breakout, and I have explained all these chart patterns in my separate article, where you will get to know them in detail.
Price Action for Downtrend
For downtrend moves, you need to search for the double-top pattern, and you guys know selling always happens fast if it's spending time in a certain level, which means it can give you upside moves. Let me explain to you while diving into the char pattern,
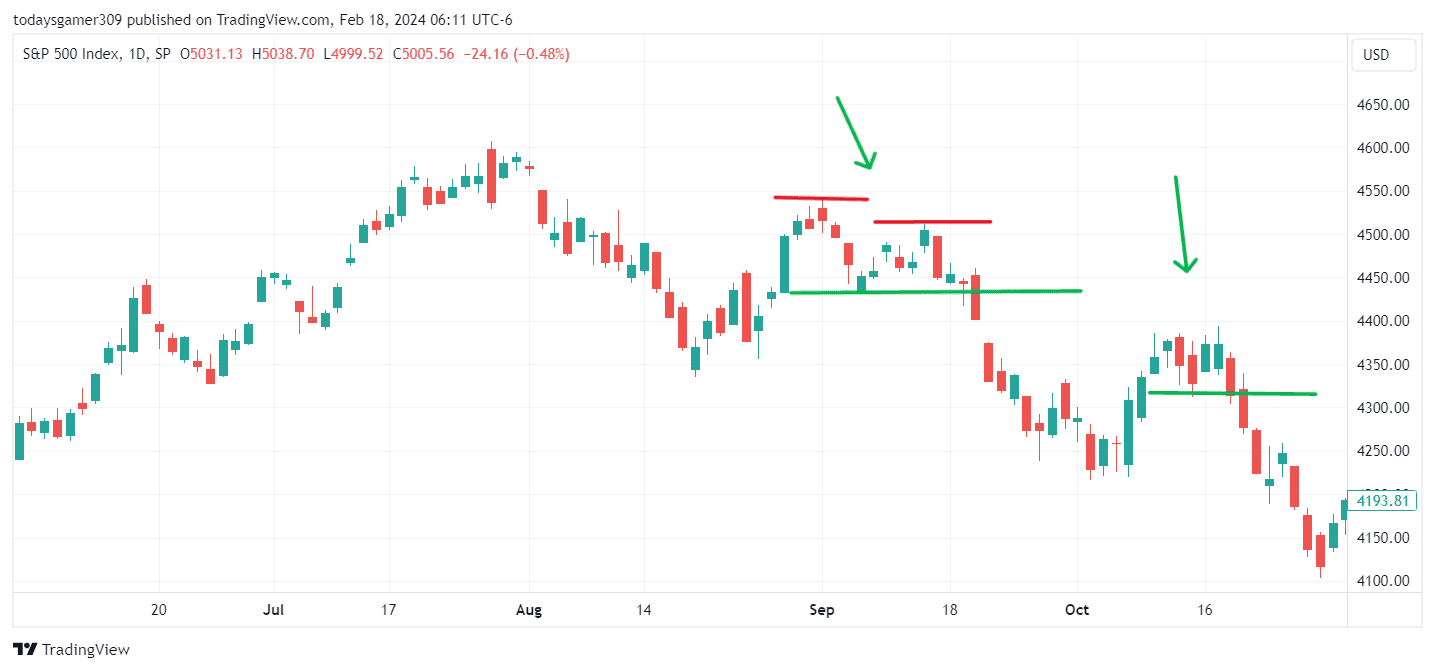
If guys see this chart pattern, it looks like a double top. When the market makes a high swing, if it touches the level for the first time, this case high swing will work as a resistance, where the seller will be active again, and the selling will continue.
But remember, there are differences between double top vs pole and flag pattern.
Price Action Pattern for Downtrend
- Double Top Pattern
- Head and Shoulder Pattern
- Bear Flag Pattern
- Mother and Baby Candle
- Bearish Engulfing Pattern
These are the chart patterns for trend reversal if the market moving in an upside direction.
50% Recovery Breakout Rule
A breakout will be sustainable only if it does not recover more than 50% of its trend, thus how the price action works in trading. If it recovers more than 50%, then the buyer will be weak, so the seller becomes active again.
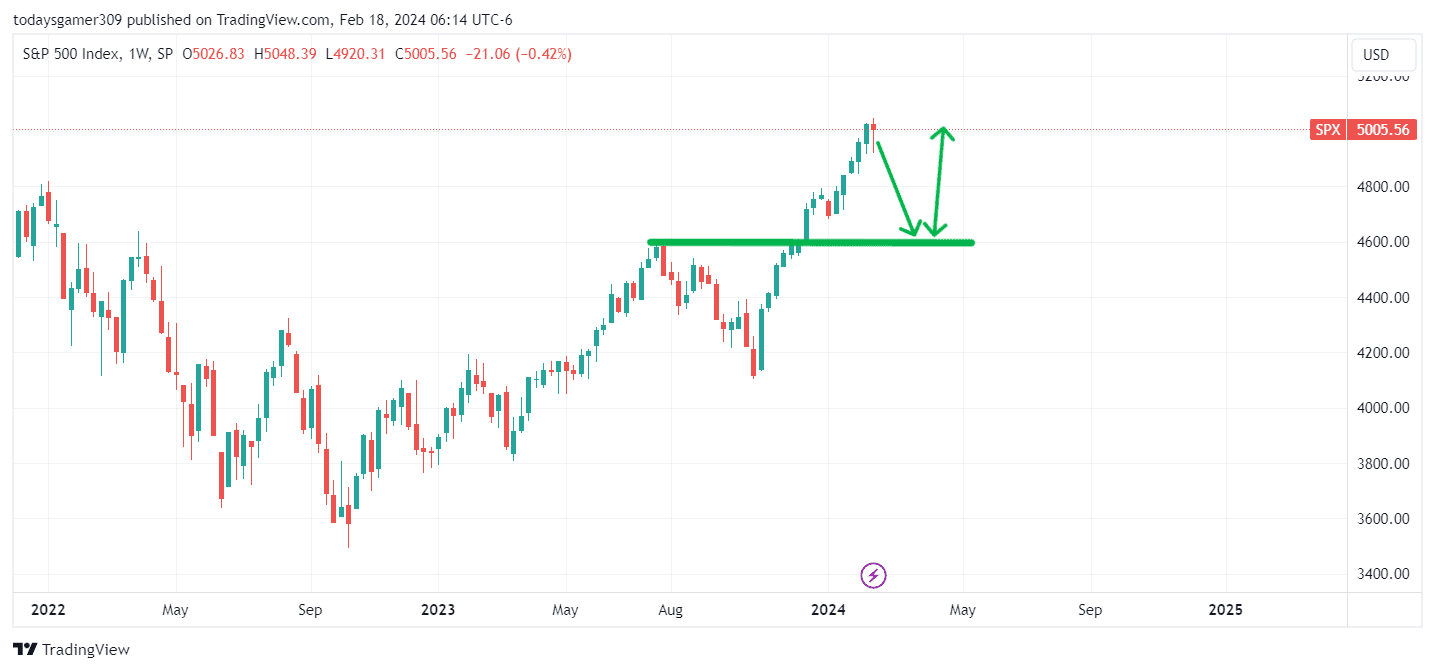
In this case, the breakout will fail. Let me walk you through some examples in the chat pattern,
In this pattern, I thought it would create a double top, but later, it created a pole and flag pattern, and if you noticed, it does not recover more than 50% of its trend and then gives a breakout upside.
Conclusion:-
This is how the price action works, and I tried to keep things simple, but remember that most of the strategy has 50-60% accuracy.
Disclaimer
The information provided here is only for educational purpose. The information provided here is not intended to be any kind of financial advice, investment advice, and trading advice. Investment in stock market is very risky and trading stocks, options and other securities involve risk. The risk of loss in stock market can be substantial. So before taking any decision or before investing in any Share consult your financial advisor and also do your analysis and research.