Mother and Baby Candle Trading Strategy - Option Trading
Updated at: 12 June 2025Deepak Painkra
After a continuous downtrend or uptrend, when the market pause, it will create a mother-and-baby candle. In this article, we will discuss the trading strategy of mother-and-baby candles.
Table of Content
- What is Mother and Baby Candle?
- Different Scenarios When Mother and Baby Candle Gets Formed
- After a Downtrend
- After a Downtrend
- Mother and Baby Candle Trading Strategy
- What should be the target?
- The Ideal Time Frame for Candlestick Patterns,
- Are these things Functional in any Markets?
- Drawbacks of Mother and Baby Candles
- Conclusion
What is Mother and Baby Candle?
When the mother candle completely engulfs the baby candle, it is called the mother and baby candle. And Let me show you the example of the Mother and Baby candle.
Different Scenarios When Mother and Baby Candle Gets Formed
There are different-different scenarios when the mother and baby candle gets formed, and let me explain to you in detail,
- After a Downtrend
- After a Uptrend
After a Downtrend
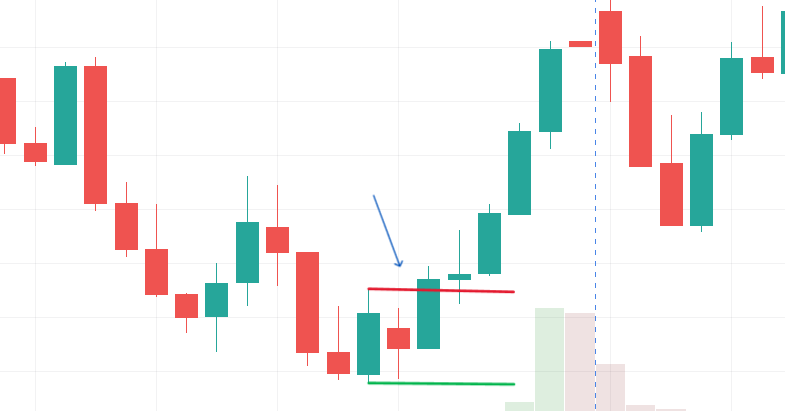
When the market is in continuous down trends, if it wants to change the direction, then it will create either a mother and baby candle or a W pattern, and let me show in the chart so you can have a better idea,
If you saw the chart, it's creating a mother-and-baby candle, but do not think every spike will make a mother-and-baby candle, always remember it is just a pullback.
After a Uptrend
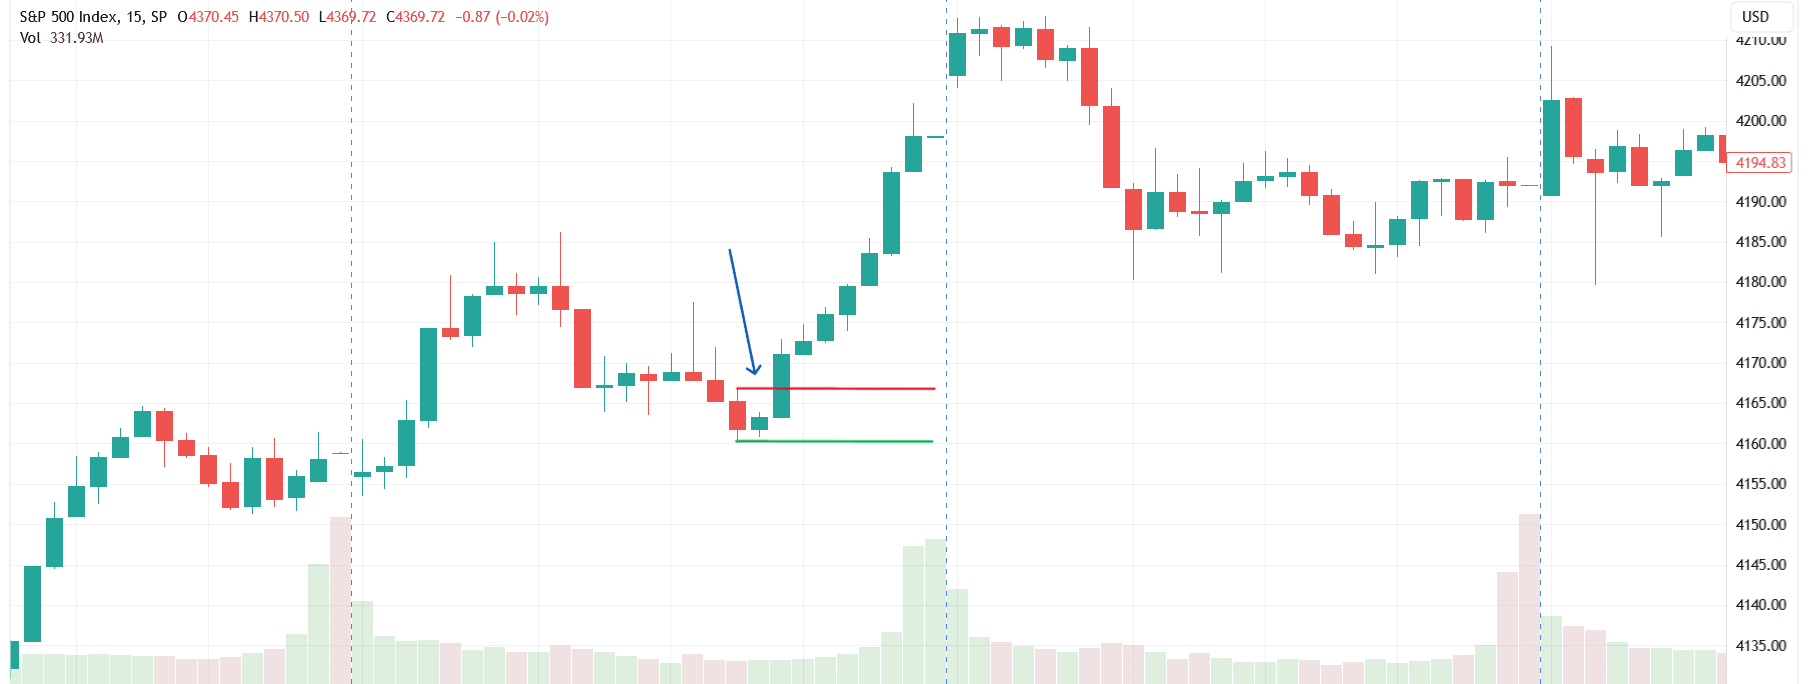
After an uptrend moves when the market pause, it will create a mother and baby candle, and I can give your so many examples, and here is one of them.
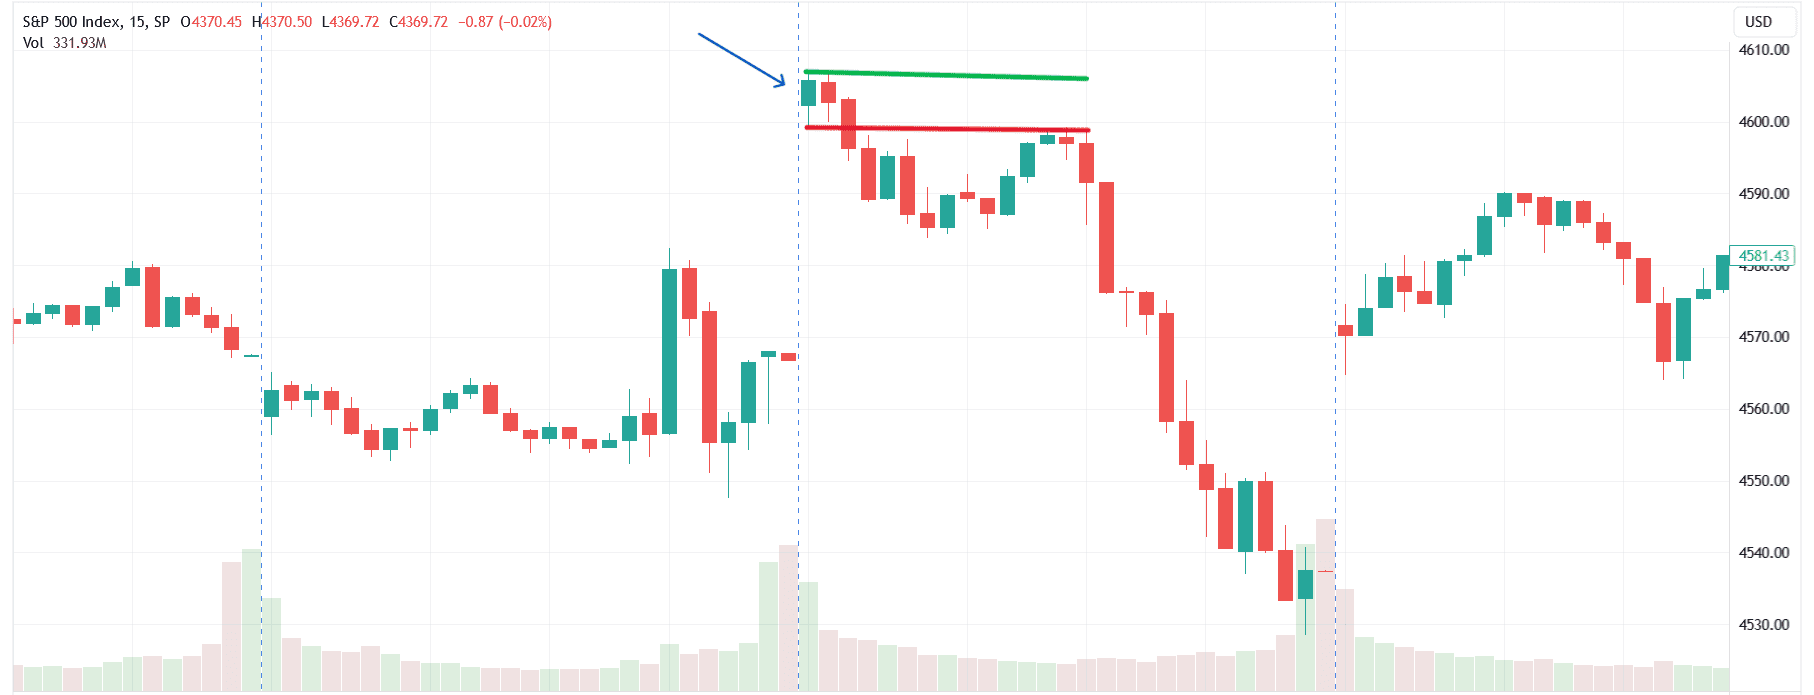
If you saw the chart, the mother and baby candle gets formed in an uptrend.
Mother and Baby Candle Trading Strategy
If the chart breaks the baby candle, then you can take a trade with a small quantity, but when it passes the mother candle, you can think of increasing the quantity sizing, but only if the chart waits at the top of the mother candle, then it gives you break out.
There are so many things to consider before trading with Mother and Baby Candle,
What should be the target?
If you projected the mother candle's entire body in the same direction, the target would be twice as big. Put your stop loss on top of the mother candle; if you put it on the upper part of the mother candle, then the stop will be larger than typical, and let me show you in the images also,
The Ideal Time Frame for Candlestick Patterns,
The 15-minute or 1-hour time frame will be best for practice, and you can even go longer wherever you gain enough experience in the market. In my case, I use this chart pattern to see the market direction, and the time frame we can use is 15 min, 1 hour, day, week and even month.
Are these things Functional in any Markets?
Yes, it is possible, but only with the necessary practice, so you must try in the stock market, cryptocurrency, and forex, but before taking any decision, please do your analysis.
Drawbacks of Mother and Baby Candles
- Stop loss will be bigger than usual.
Conclusion
Nobody can predict where the market will go, the strategy or chart pattern has a winning rate of between 60 to 70%, and trading is all about psychology and risk-to-reward ratios, but skill is needed.
Disclaimer
The information provided here is only for educational purpose. The information provided here is not intended to be any kind of financial advice, investment advice, and trading advice. Investment in stock market is very risky and trading stocks, options and other securities involve risk. The risk of loss in stock market can be substantial. So before taking any decision or before investing in any Share consult your financial advisor and also do your analysis and research.